Dec 17th, 2019
Version 12.0 offers new chart functionality
The 3 chart highlights include:
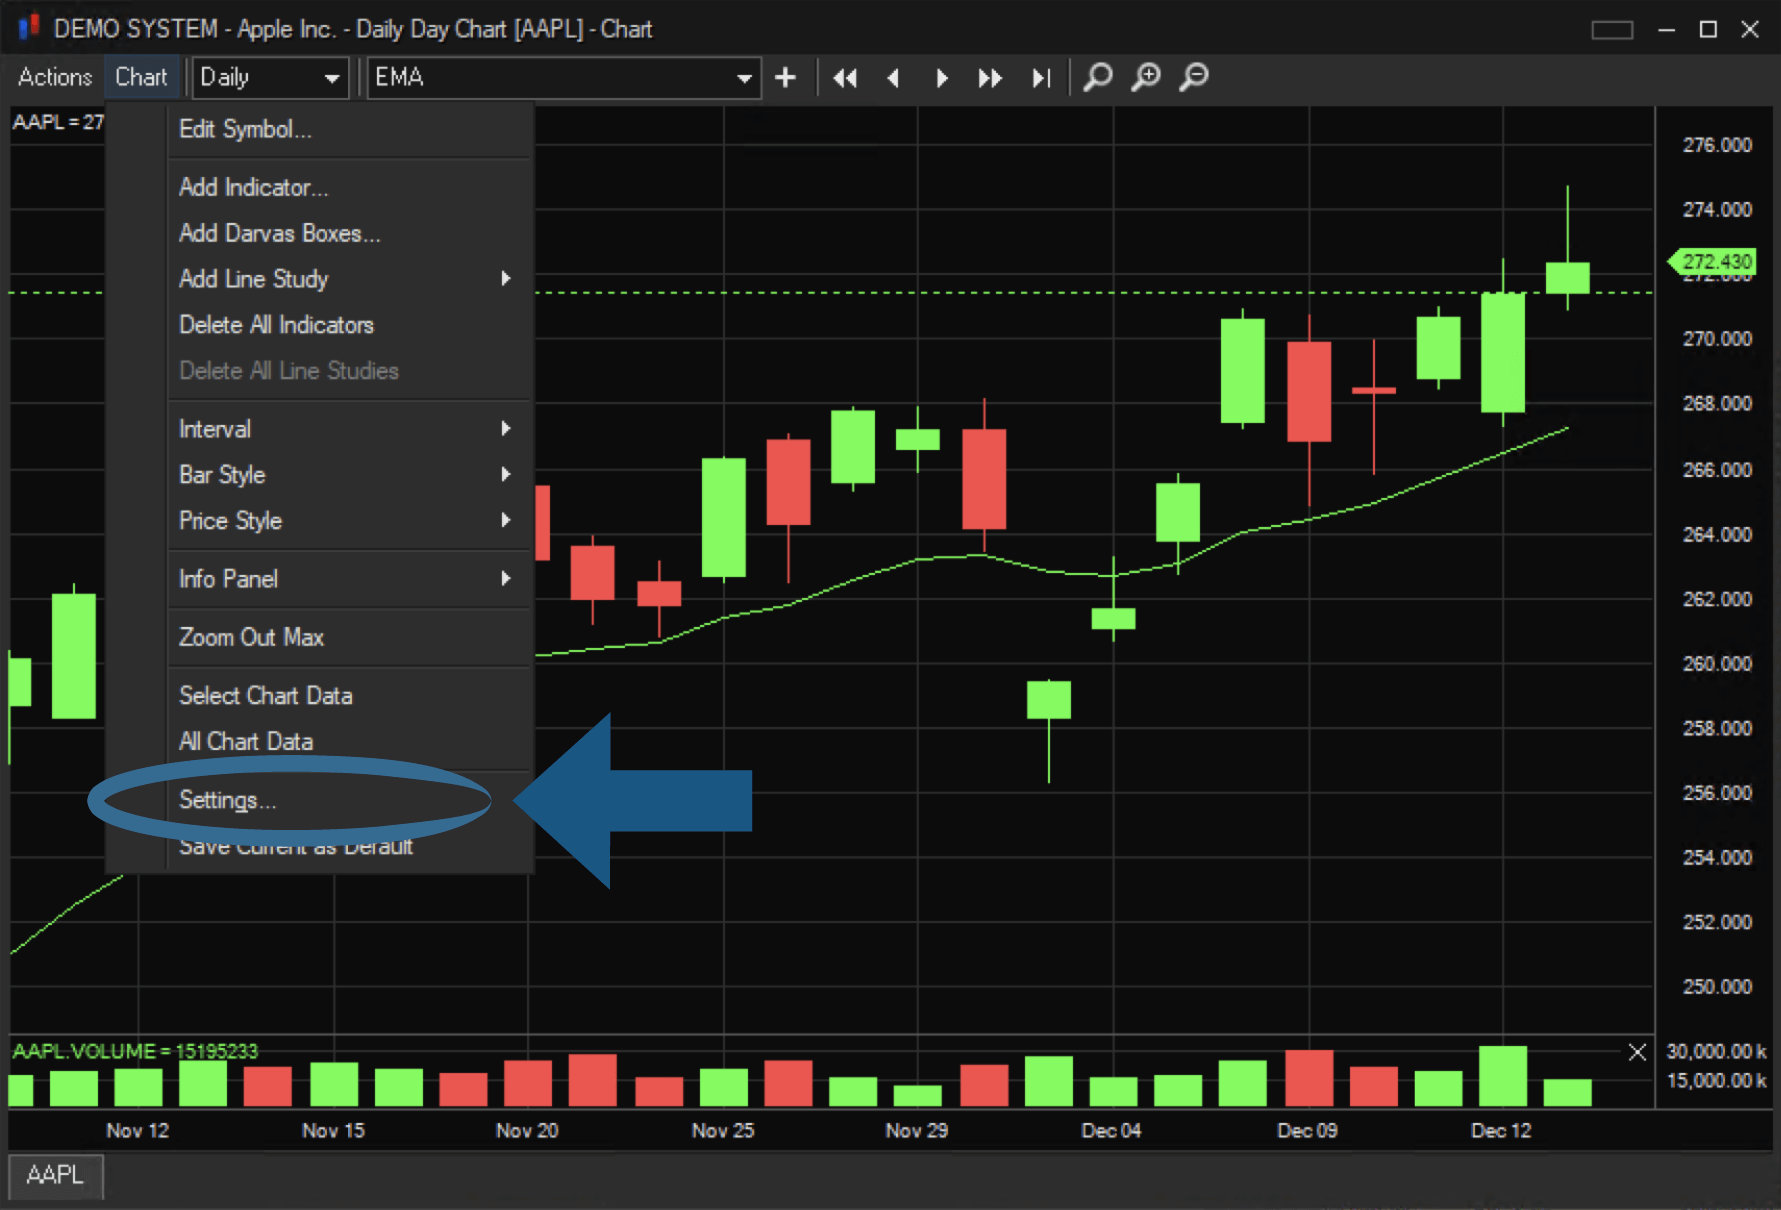
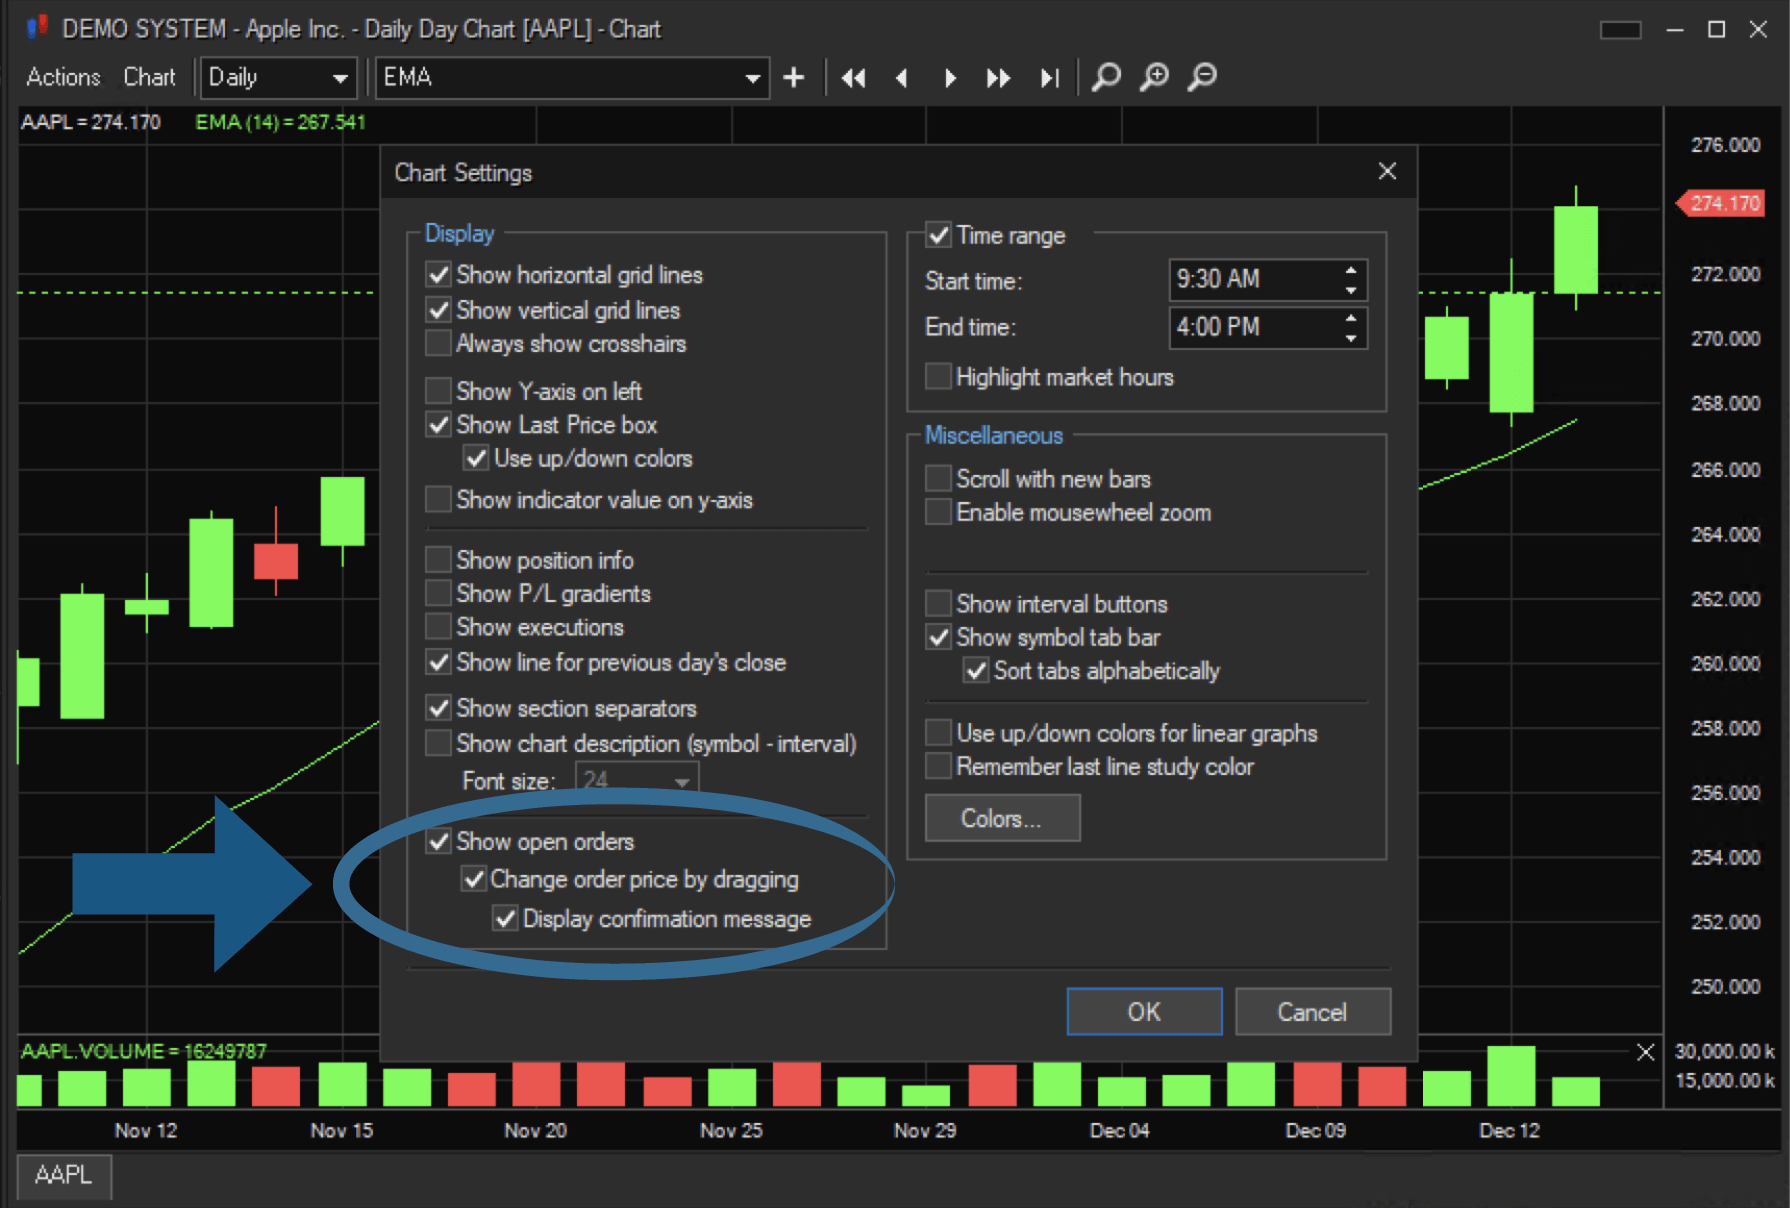
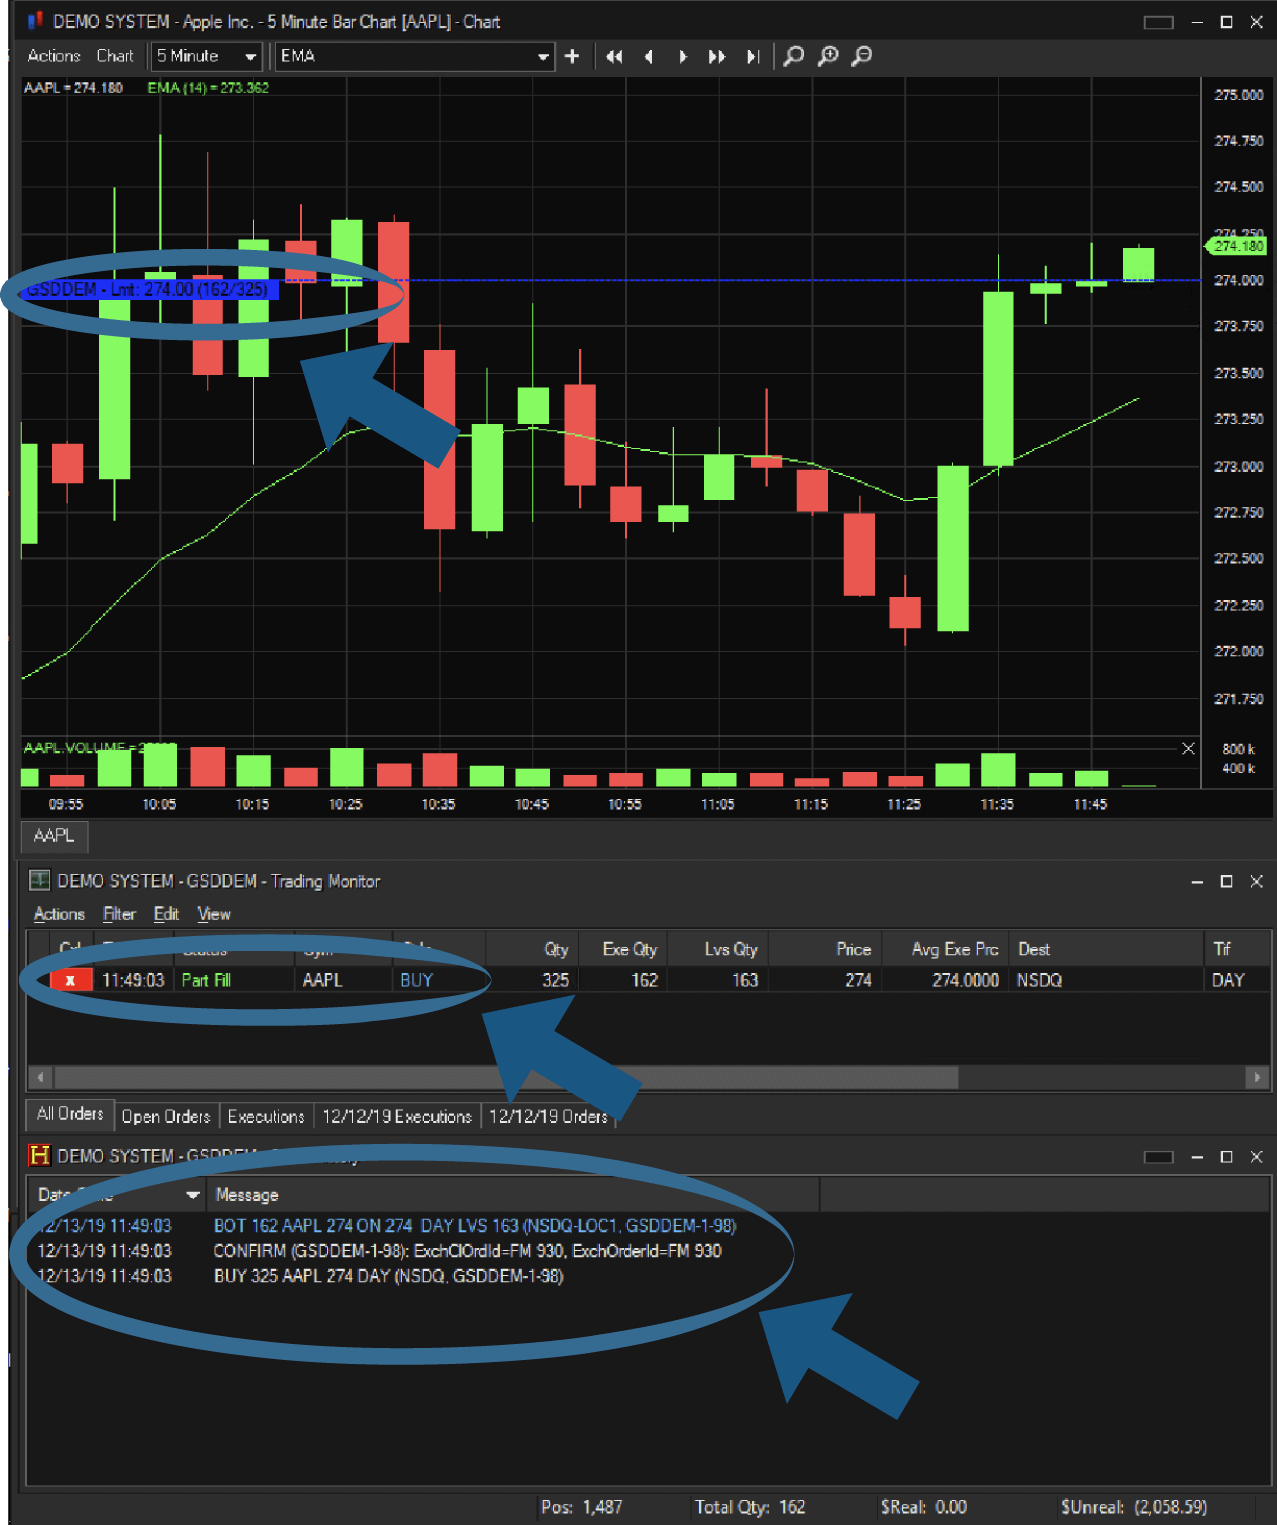
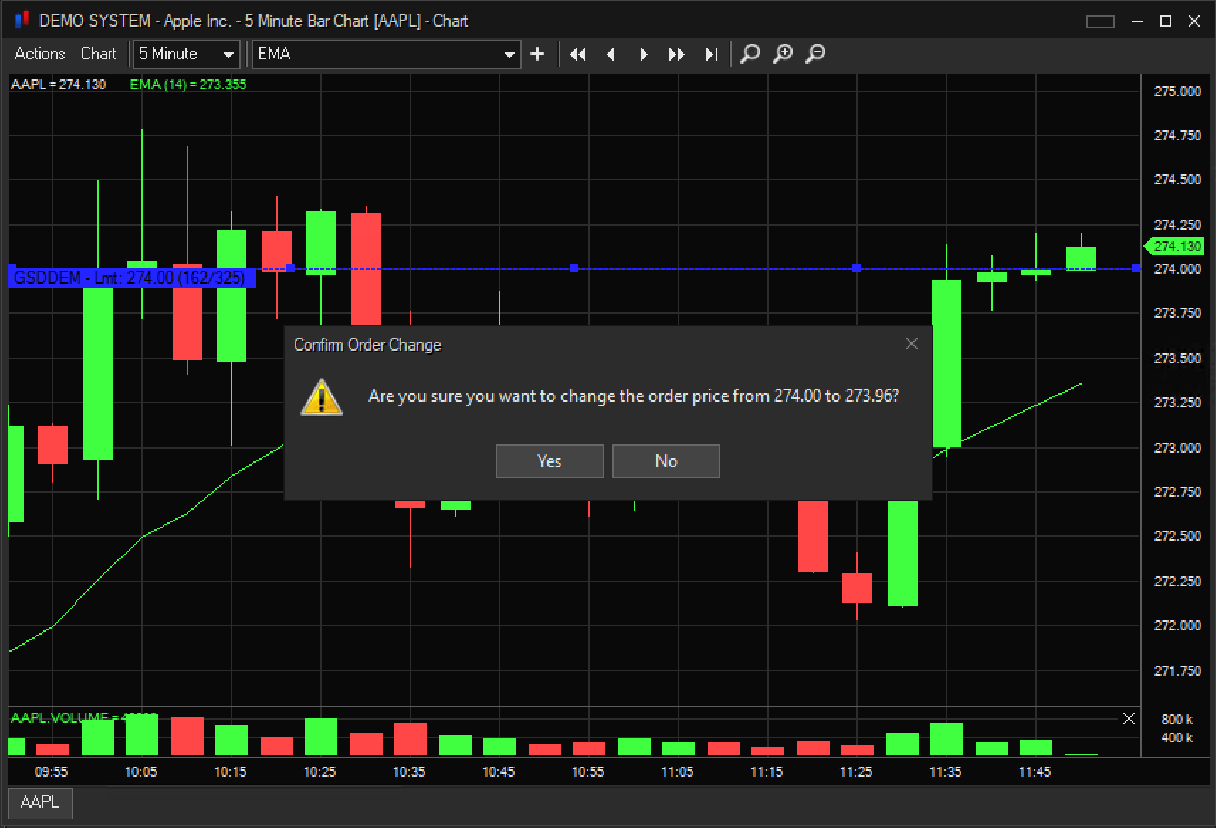
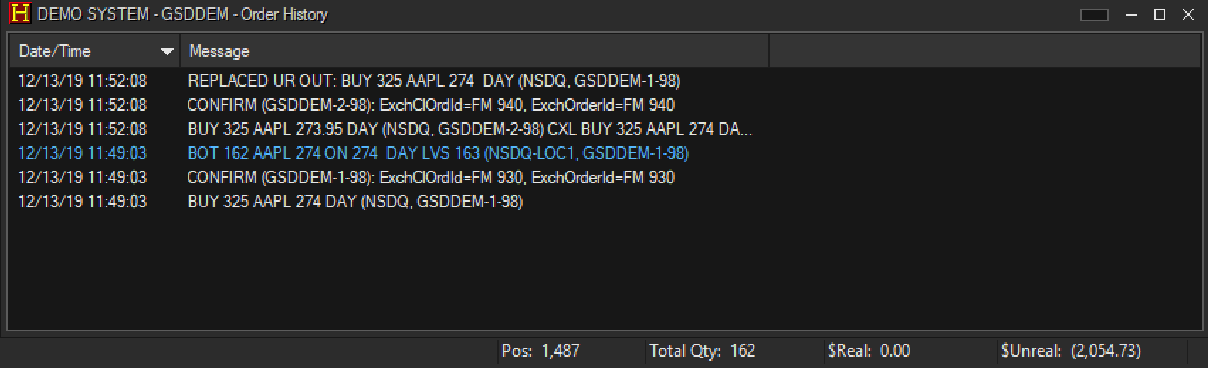
The Open Order shows in the Trading Monitor and as a blue line in the Chart Window.
To modify the order, click and drag the line, and click YES to accept.
The accepted change will appear in your Order History.
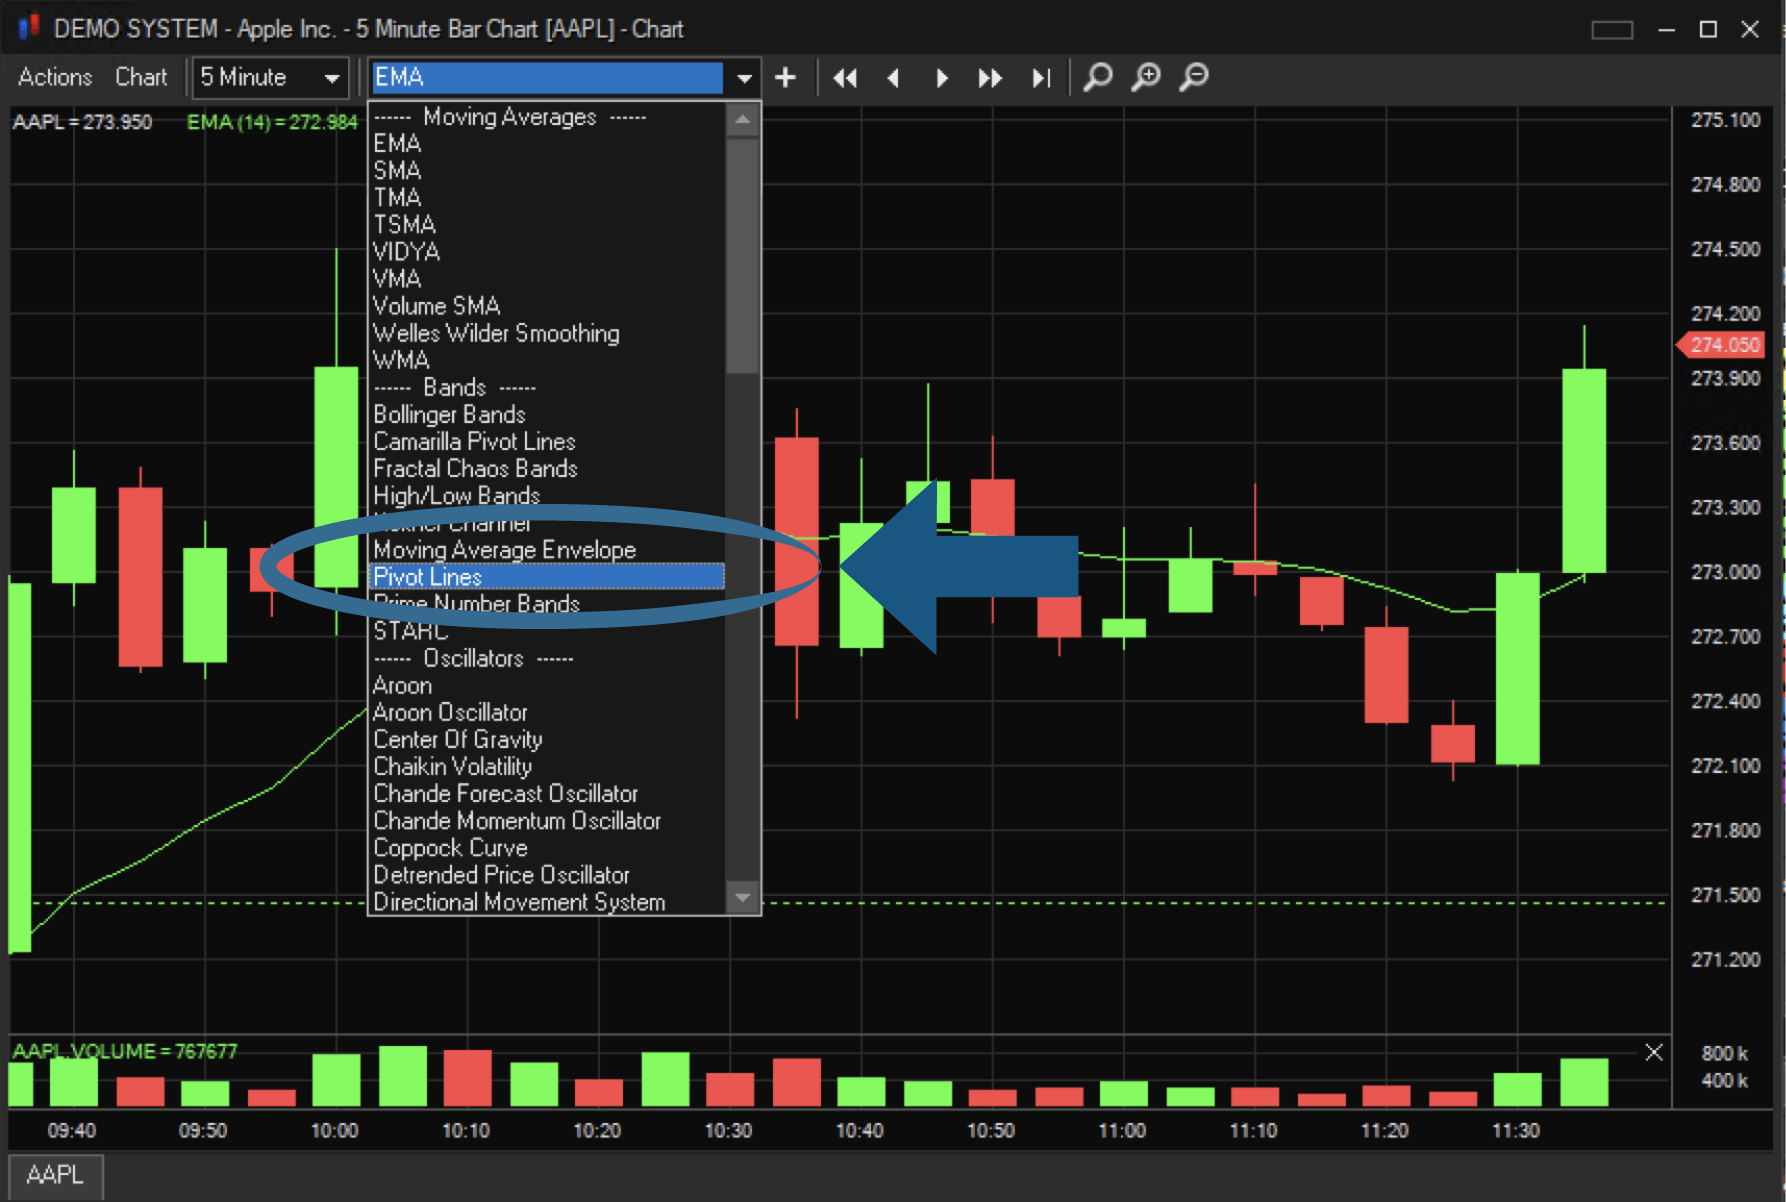
The default Pivot Line Color is White.
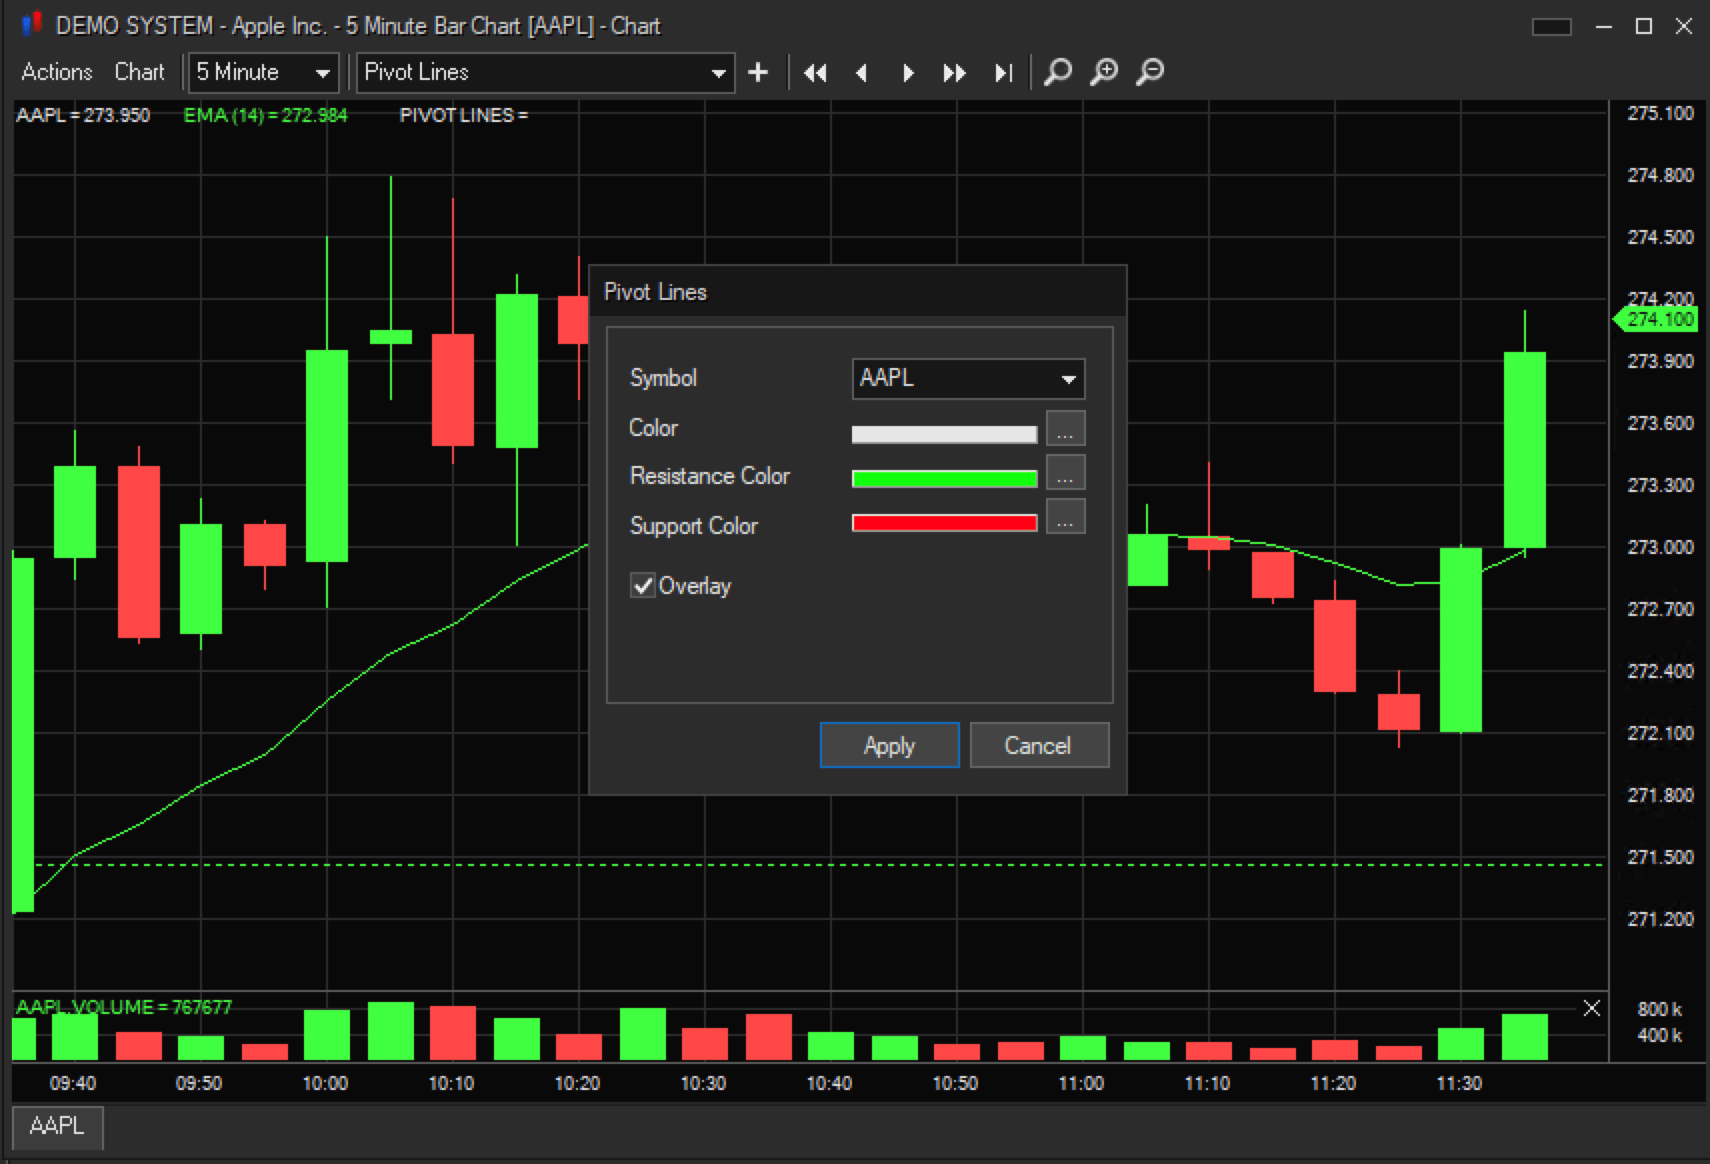
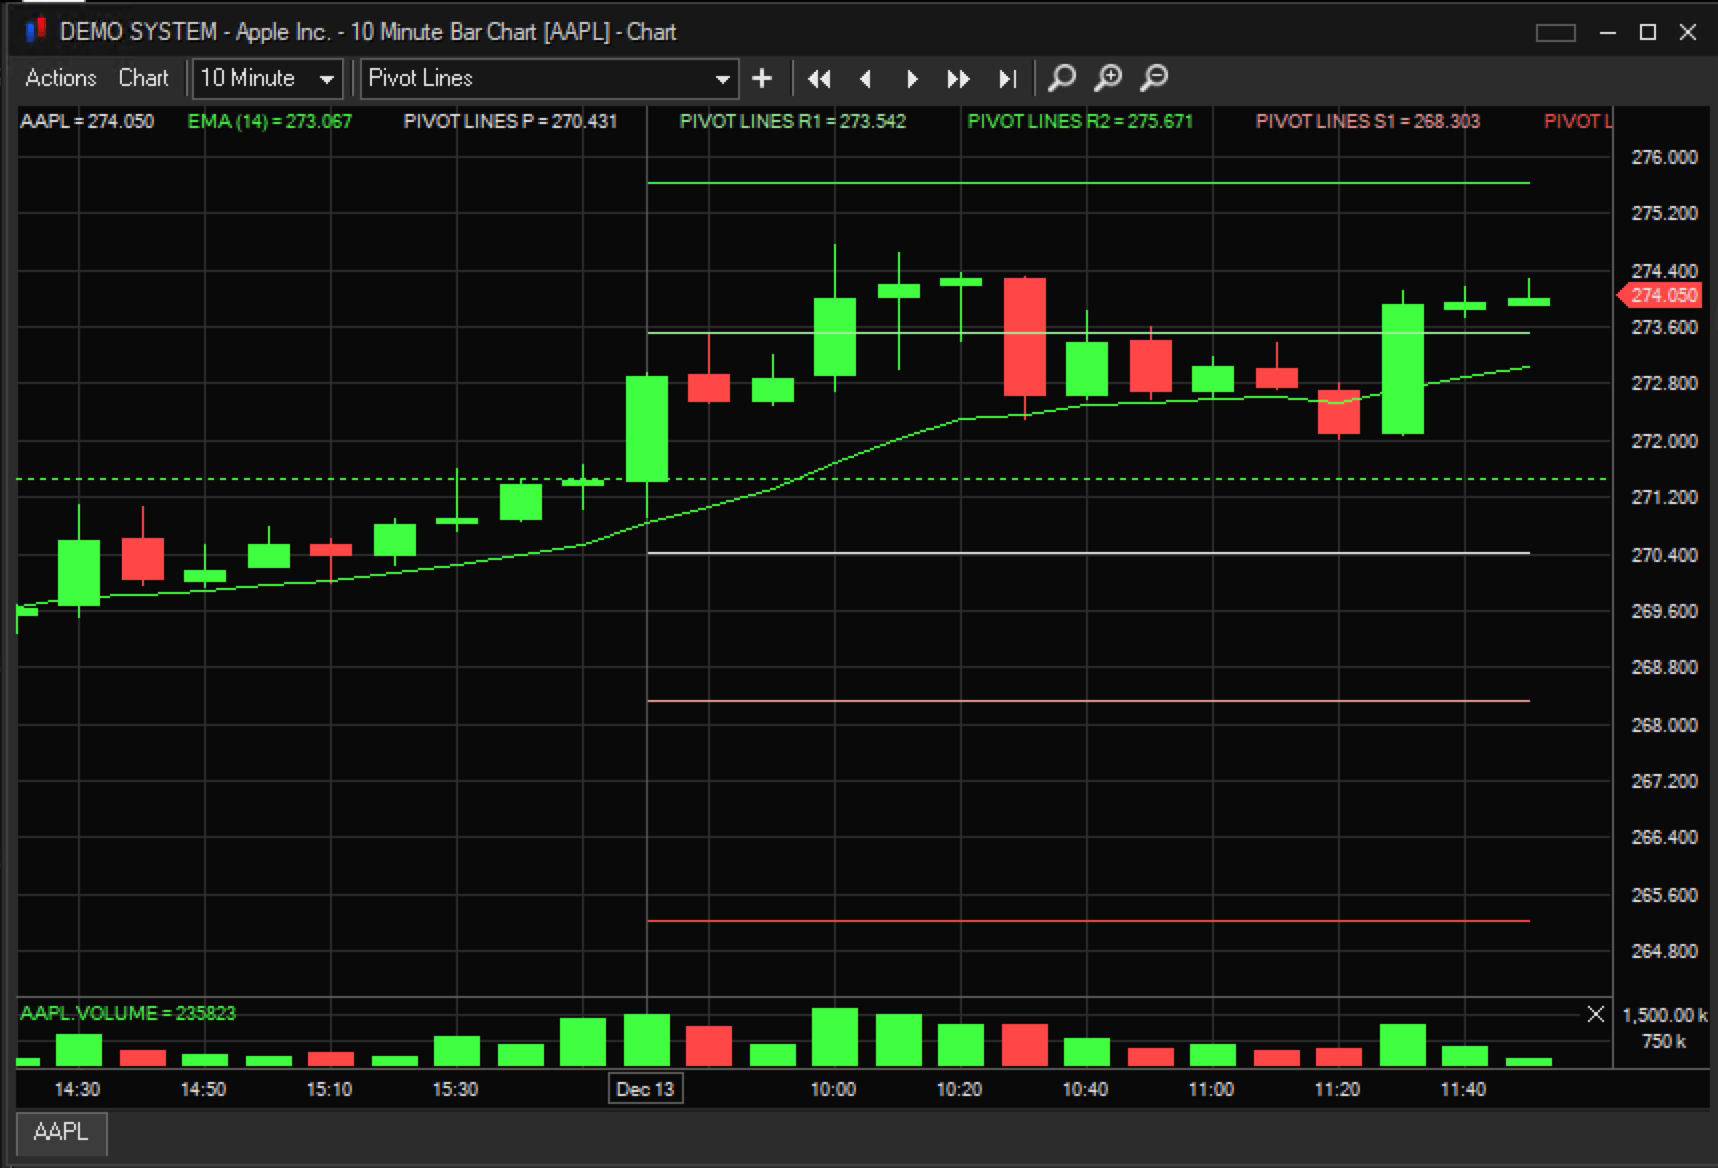
The white line is the pivot line, with the two lines above being levels of Support (S1, S2) and the two lines below being levels of Resistance (R1, R2)
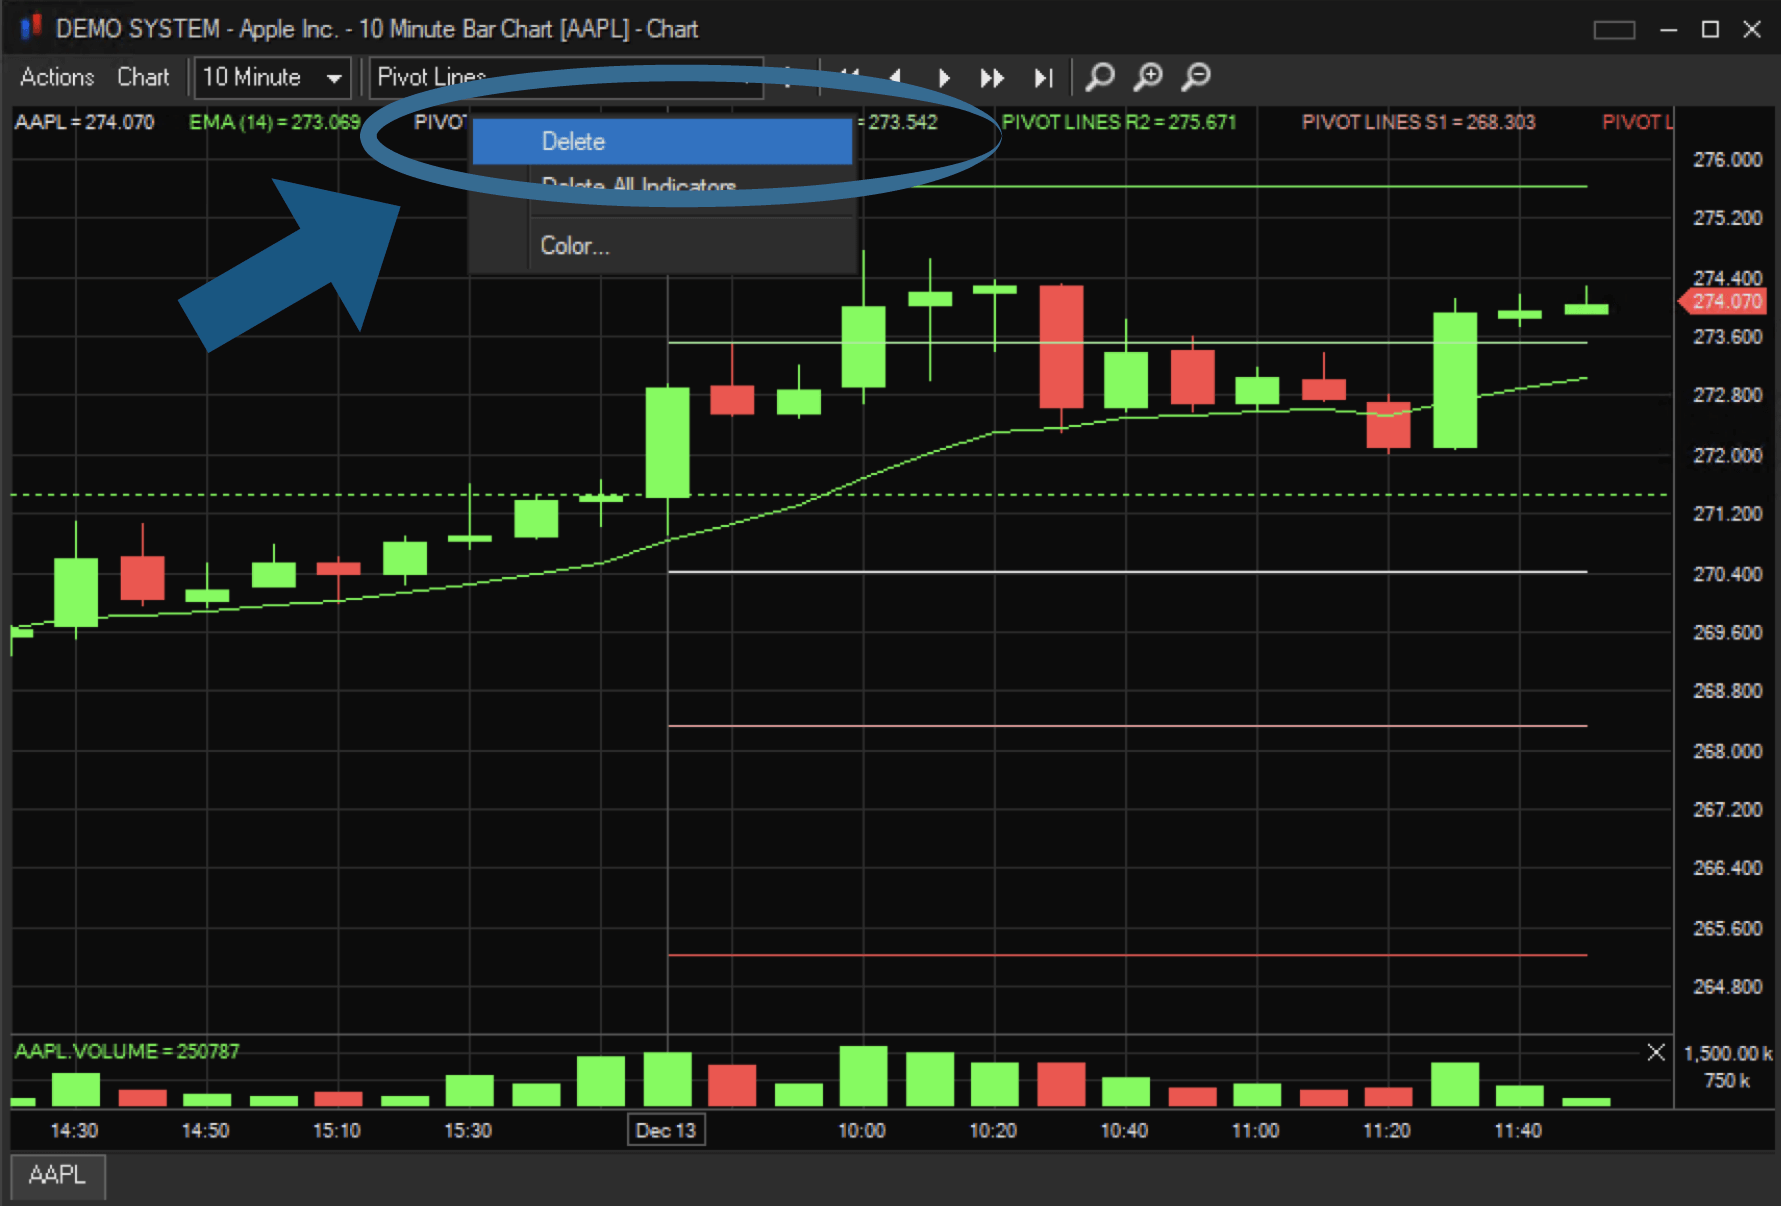
To delete any study, right-click on the study at the top of the chart.

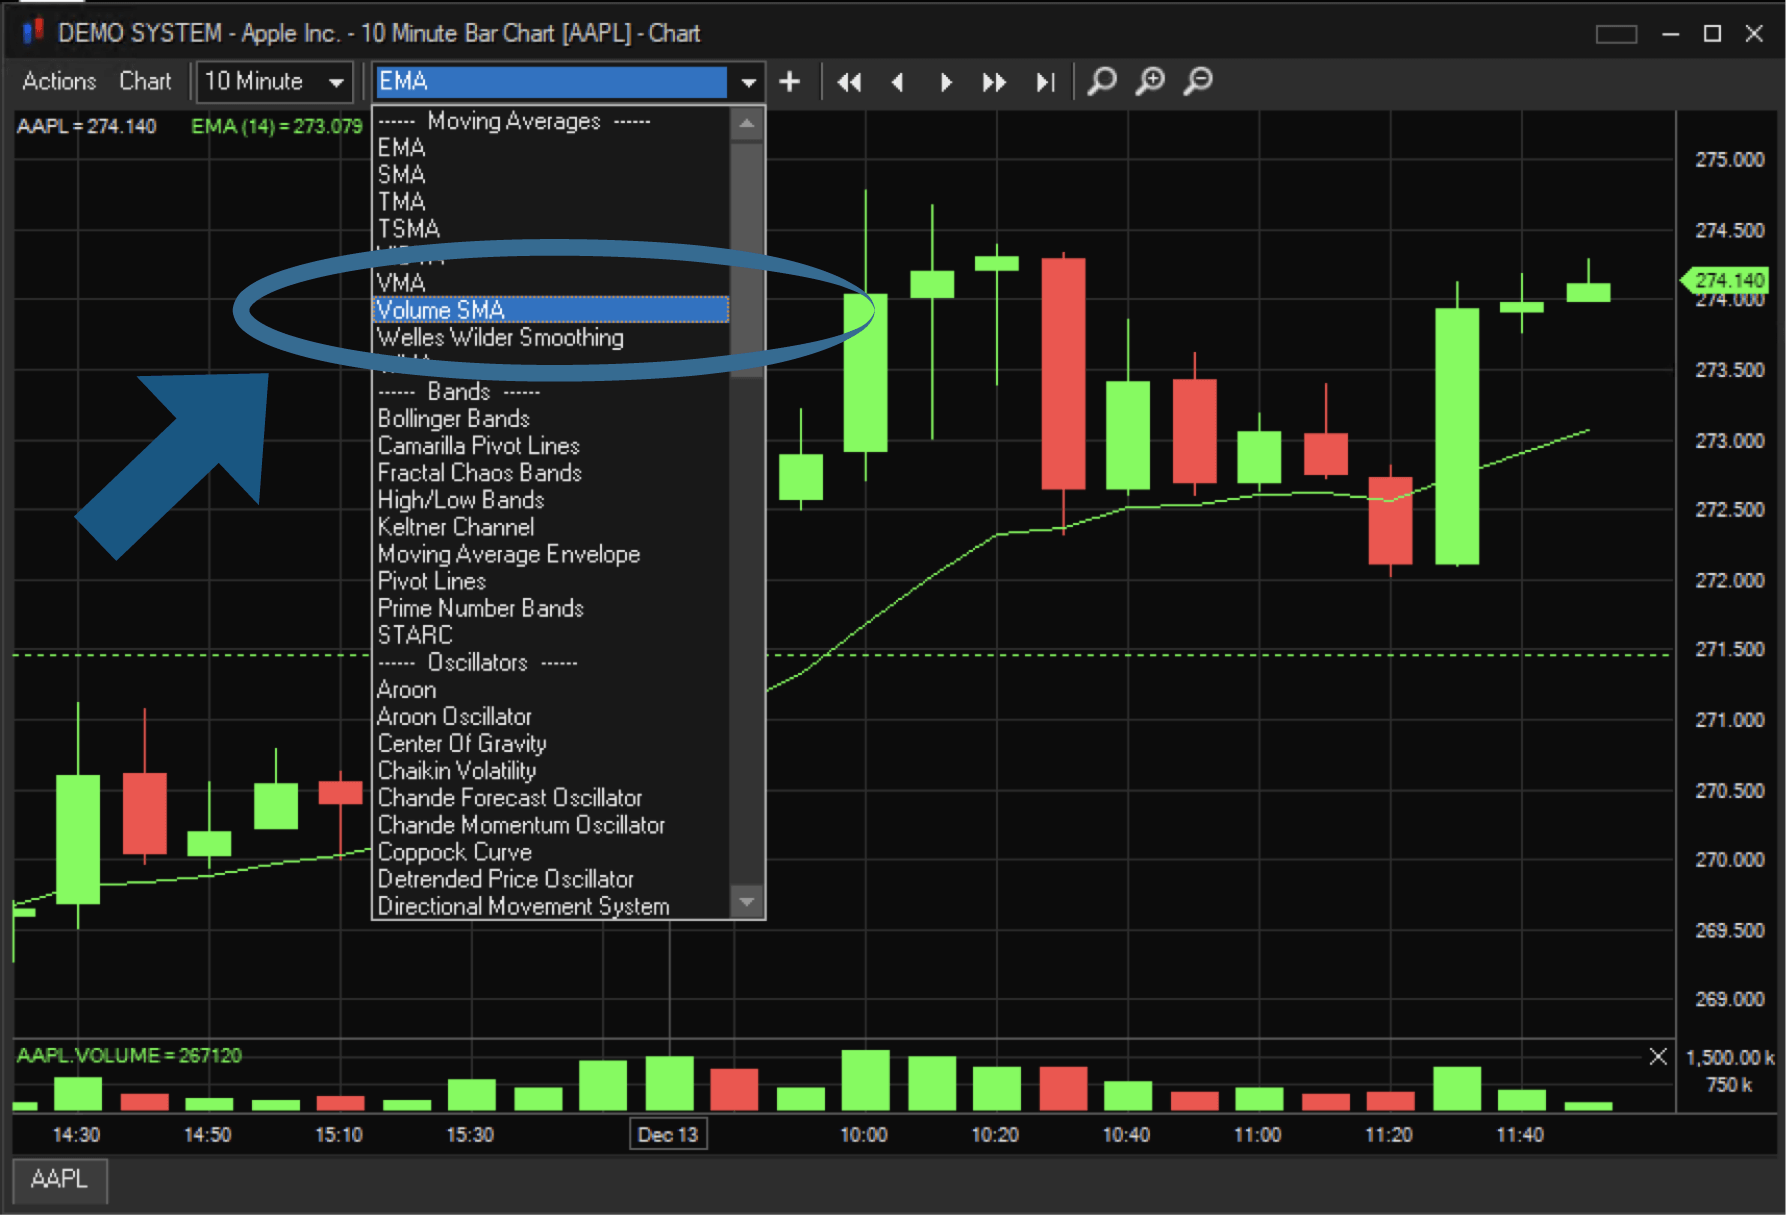
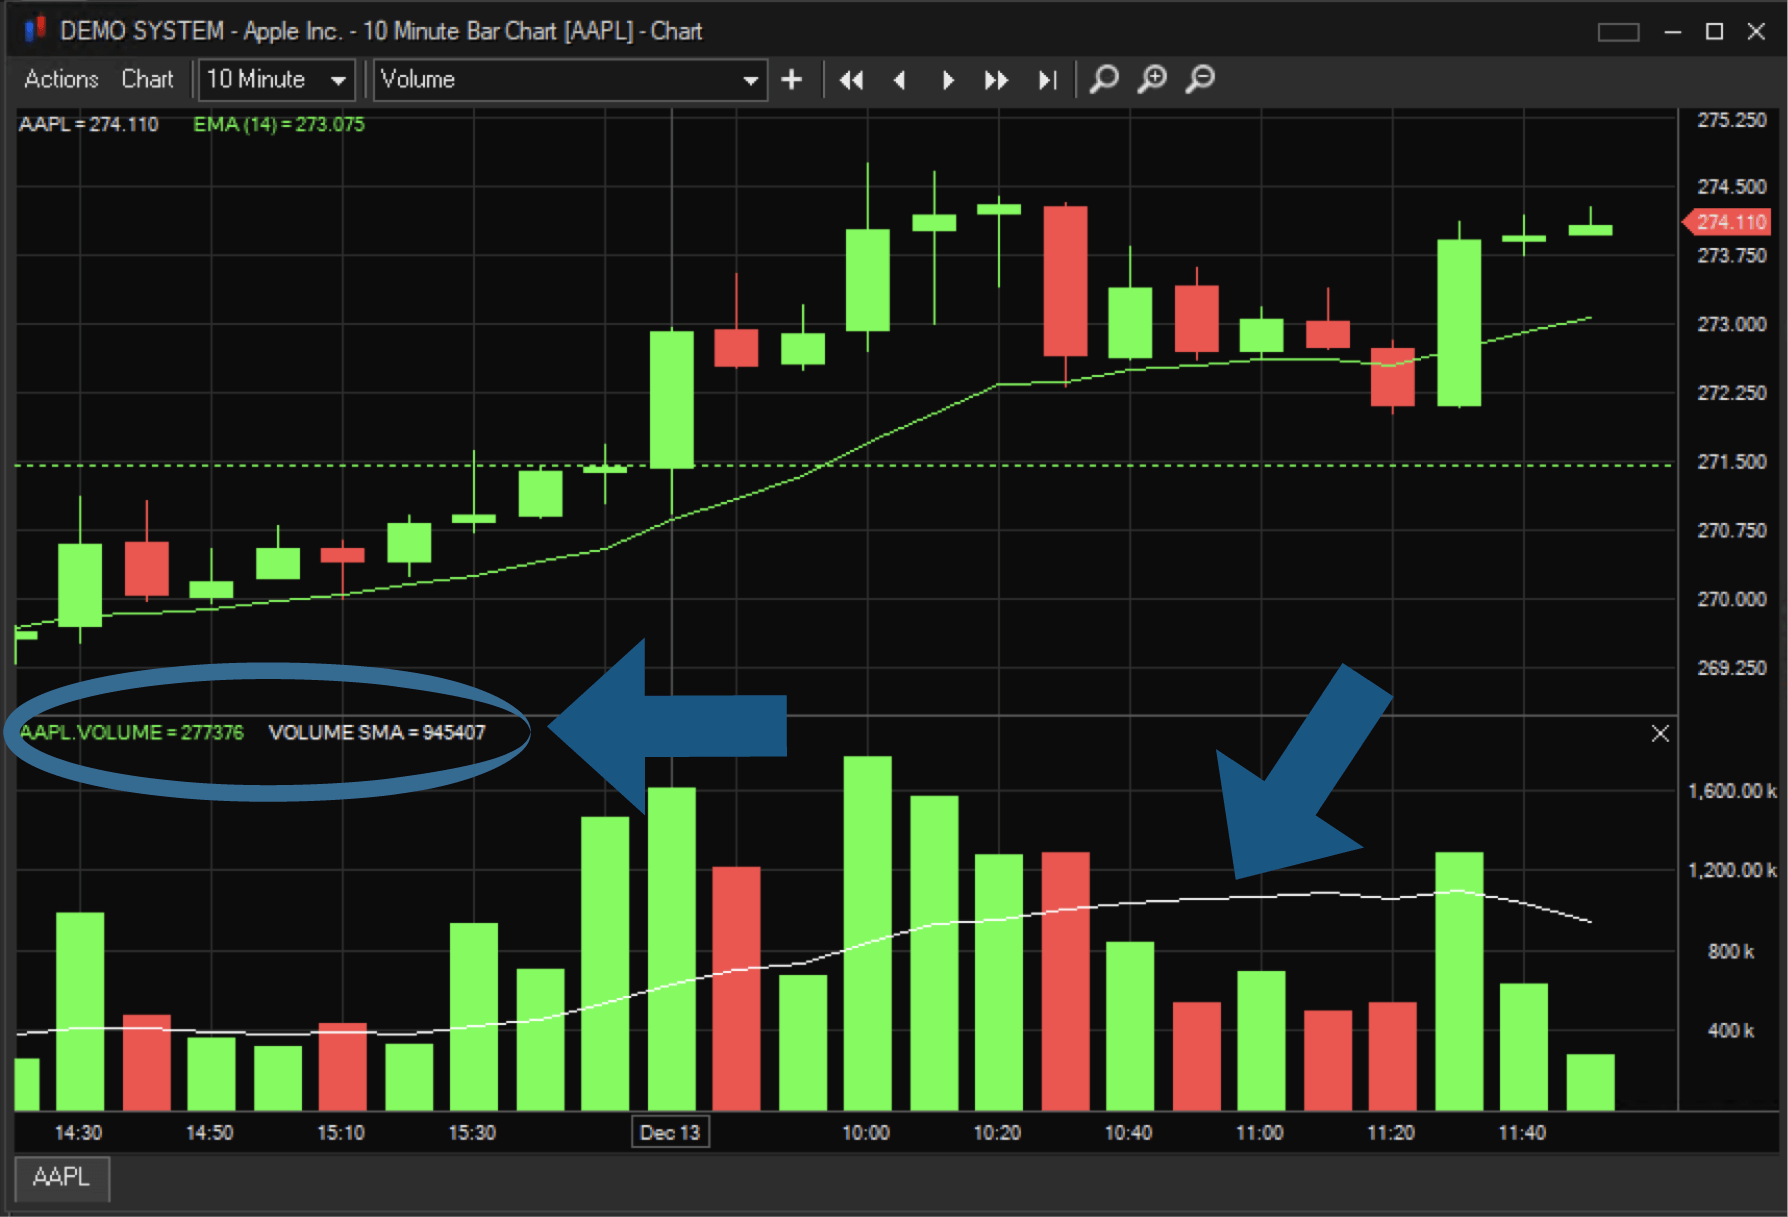
Next, add a Volume SMA onto the volume study.
The Simple Moving Average (SMA) is calculated by adding the price of an instrument over a number of time periods and then dividing the sum by the number of time periods. The SMA is basically the average price of the given time period, with equal weighting given to the price of each period. This is shown in the white line below.
We look forward to learning more about your trading needs.

Sterling to Add Fixed Income Support to Risk & Margin Service - Continues product innovation in anticipation of client risk and regulatory mandates
CHICAGO, APRIL 25, 2024 – Sterling Trading Tech (‘Sterling’), a leading global provider ...

Sterling Trading Tech Readies Broker-Dealers and Clearing Firms for May 28 T+1 Compliance
CHICAGO, March 20, 2024 – Sterling Trading Tech (STT), a leading global provider of ...

Asia buy-side firms are demanding more from their tech as derivatives boom
With derivatives trading in the APAC region reaching 103.5 billion contracts in 2023 and ...